Life table的python dashboard
life table
在生存分析中,life table有助于我们快速理解在一定时间内药物与相关不良事件的关系。
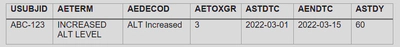
在ADAE中,我们可以拿到我们感兴趣事件发生的相关信息。如,我们关注increased ALT level,那么我们可以拿到increased ALT level的发生时间、结束时间,以及increased ALT level的严重程度。这些信息可以帮助我们理解药物与increased ALT level的关系。如下图所示:
借助以上信息,我们可以将时间分段,整理出如下的life table:
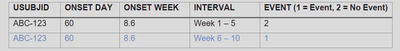
其中,由于在week 6-10区间内已经发生关注事件,则在之后的时间内该受试者不再处于at risk。
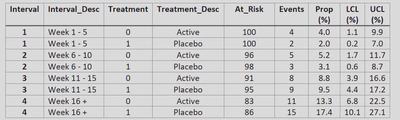
计算事件发生率及95%CI
在某区间内,关注事件发生率的计算公式为:
$$ prop = \frac{number\ of\ events}{number\ at\ risk} $$
其95%置信区间的计算我们采用clopper-pearson方法。
SAS代码:
ods output binomial = stats;
proc freq data = prepped_data ;
  by treatment_id risk_week;
  tables event / binomial;
  weight wgt / zeros;
  exact binomial;
run;
汇总统计后的数据集如下:
python dashboard
我们将借助python将life table以dashboard的形式展示出来。主要代码如下:
import matplotlib.pyplot as plt # import library

plt.figure(figsize = (10, 5))
plt.plot(active['Interval'], active['Prop (%)'], 'r.-', label = 'Active')
plt.plot([active['Interval'], active['Interval']],
  [active['LCL (%)'], active['UCL (%)']], 'r')
plt.plot(pbo['Interval']+offset, pbo['Prop (%)'], 'b.-', label='Pbo')
plt.plot([pbo['Interval']+offset, pbo['Interval']+offset],
  [pbo['LCL (%)'], pbo['UCL (%)']], 'b')

plt.title("Life Table for Time to First Event Onset", fontsize=20)
plt.xticks([1, 2, 3, 4], xlabels, fontsize=12)
plt.yticks(fontsize=12)
plt.xlabel("Interval (Weeks)", fontsize=12)
plt.ylabel('Proportion of Subjects With Event Onset (%)', rotation=90,
  fontsize=12)
plt.legend(fontsize=12);

mp_table = plt.table(cellText=table_text,
  colWidths=[0.04, 0.04, 0.2, 0.02, 0.2, 0.02, 0.2, 0.02],
  rowLabels=rowLabel,
  loc='bottom',
  bbox=[0, -0.35, 0.97, 0.15]
)

mp_table.auto_set_font_size(False)
mp_table.set_fontsize(12)
for k, cell in mp_table._cells.items():
  cell.set_edgecolor('w')
if k[1] < 0:
  cell.set_text_props(color='k', fontsize=12)
  elif k[1]%2 ==0:
  cell.set_text_props(color='r', fontsize=12, ha='right') # red text
  elif k[1]%2 !=0:
  cell.set_text_props(color='b', fontsize=12, ha='center') # blue text
此外,我们借助plotly以及dash,可以将life table以dashboard的形式展示出来。最终效果如下:
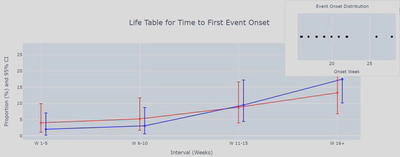
完整代码已经放到星球,欢迎大家下载查阅。